We’re operating in a new paradigm. That much is clear. And every business and organization is being impacted in different ways. In times of uncertainty, I find data comforting — especially because data gives you real, solid insights on how you may better shape or fine-tune your website to perform better. When everything is up in the air, your website data can help you stay grounded!
Maybe you’re a brick and mortar store that is shifting to ecommerce. Maybe you’re a nonprofit that is distributing important information and resources. Maybe you’re a manufacturer that needs to showcase key services.
Regardless, understanding how people are coming to your website and engaging with it provides a range of insights that can help you run your business better and improve your margins.
In the following, I share how to view several important data sets in Google Analytics and some of the insights you could possibly glean by exploring those data sets for your own website.
Geographical and Demographical Data
The geographical data section within Analytics can be sorted in several useful ways. You can see your site visitors broken down into top states, cities, or metro areas.
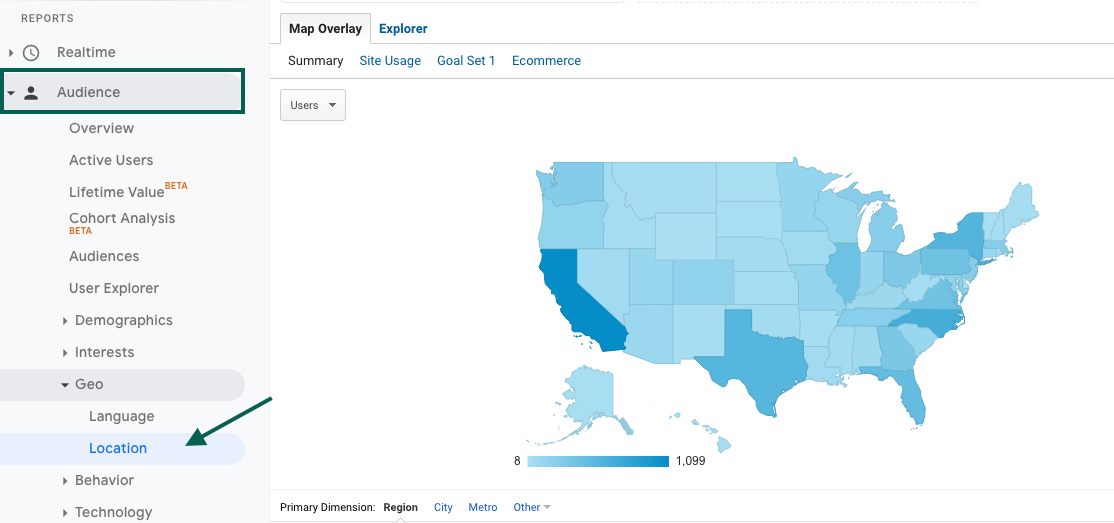
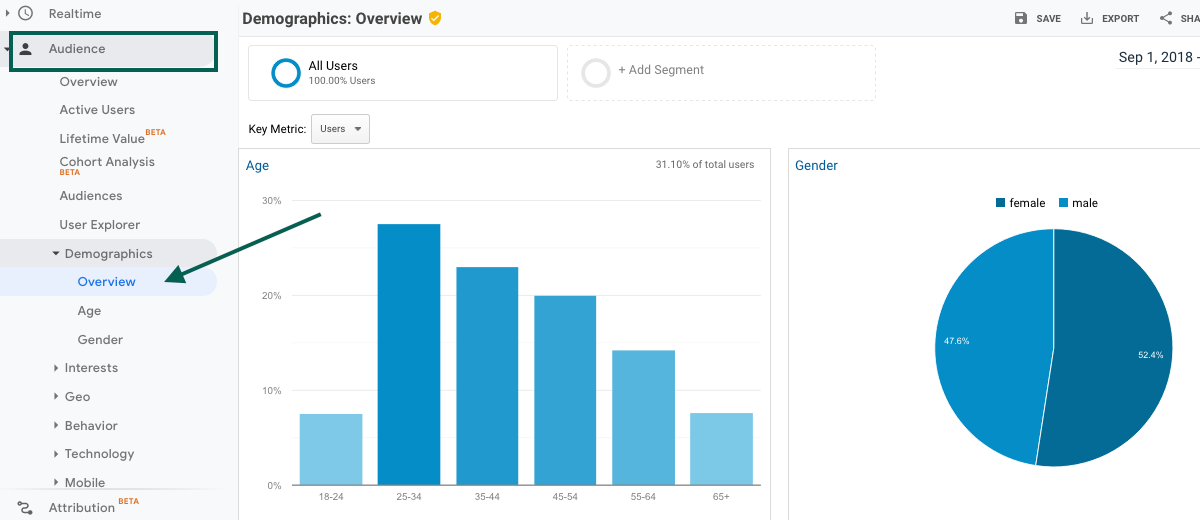
Once you enable demographics within your Analytics account, you’ll also be able to see your audience broken down by age and gender.
How It’s Useful
Your geographic and demographic website data is super useful for leveling up or launching a social media advertising strategy. For example, are most of your customers in California? Build location-based audiences for paid Facebook ads that are tailored to that location. Creativity is the only limitation in using this data to fine-tune paid advertising strategies.
Mobile vs Desktop Traffic Data
The mobile data breaks up your website traffic by mobile device, desktop, and tablet.

How It’s Useful
Analyze your mobile data to gain user insights into your site usability on a mobile device. If most of your site visitors arrive on a mobile device, which is likely, but they aren’t spending much time on your site or taking important actions, it’s likely your site needs some work on the mobile front. In the above example, you’ll see that while the majority of site visitors are using a mobile device, most ecommerce transactions are taking place on desktop. That indicates that the mobile shopping experience needs improvement.
Channels and Goals
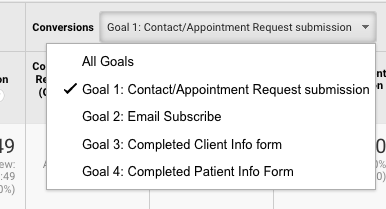
The channels section shows the different broad pathways that users took to arrive at your site. They may come from organic search results, social media, other websites, paid advertising, email, or directly. When you have goals or ecommerce set up, you can compare which channels are best accomplishing your goals.

How It’s Useful
Which channels have the most conversions or the best conversion rates? Understanding which channels are performing well or underperforming provides insights on where you should invest your time and energy.
Learn more about setting up Analytics goals.
Referral Traffic
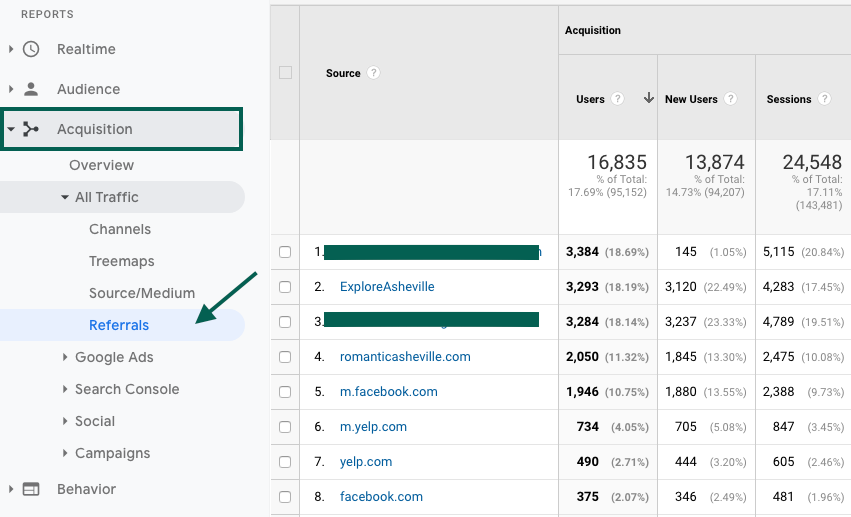
Referral traffic shares additional data on just the referral acquisition channel, which includes all visitors who arrive at your website from another website.
How It’s Useful
Many companies use relationships with other websites to build traffic to their own sites. You may write content on someone else’s website. Your product or service may be featured on review sites. You may pay for listings in tourism-related directories or information sites. Analytics shows you information to see how productive those relationships with third-party sites are. For example, if you pay to be featured on a tourism-related site, but you’re not seeing a whole lot of referral traffic from that site, you may want to reevaluate your investment.
Note: Even if you don’t get a lot of traffic from being featured on a different website, that doesn’t mean it wasn’t worth the effort. Typically, if you’re featured on another website that site will link back to you, which is beneficial for SEO.
Landing Pages
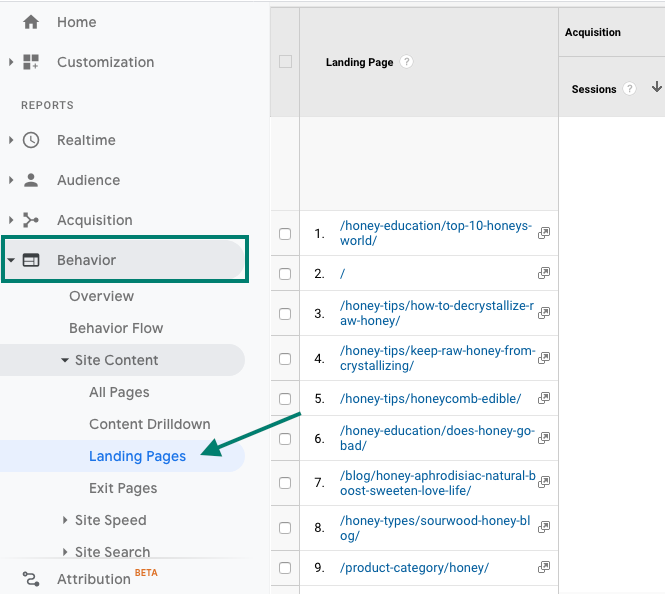
The landing pages section shows you which pages of your site users arrive on. For many websites the homepage is the predominant page visitors arrive on, yet there are usually a handful of other pages that users first arrive on, usually from search results. For example, users may arrive at specific service pages or blog posts.
How It’s Useful
If you get a great deal of traffic arriving on other pages of your site, consider adding custom calls to action or pop-ups. For example, you could add a pop-up for signing up for your email list. Or, if you sell products, you could create graphic ads driving users into your store.
Quick Tips
Use Annotations
Annotations allow you to mark important information by date so that you always see it within your Analytics data view. This is useful when you want to compare site performance year over year or evaluate the long-term impacts of changes to your site.
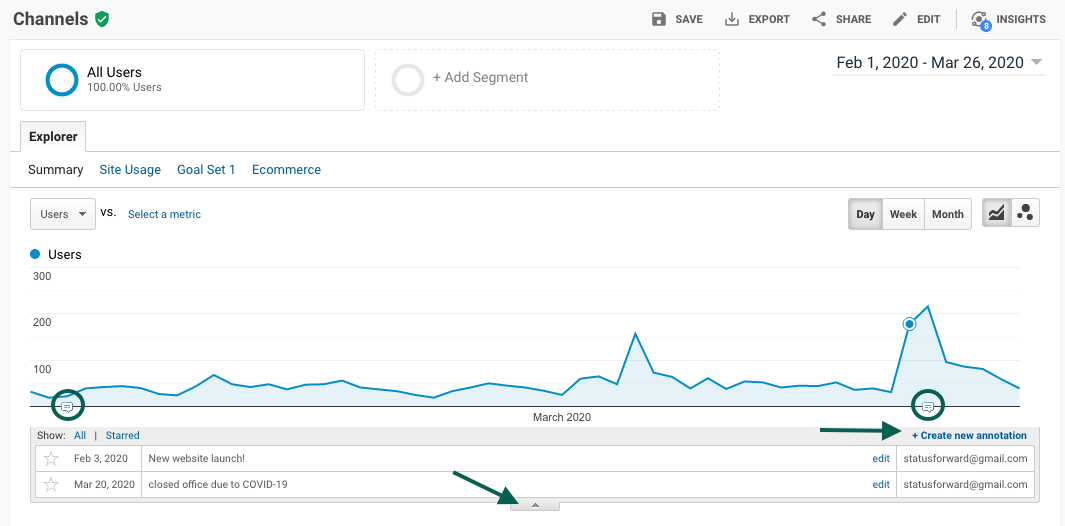
In the image above you’ll see that annotations exist for two important dates: when the new website was launched and when this company’s physical location was closed due to COVID-19.
Compare Data Year Over Year
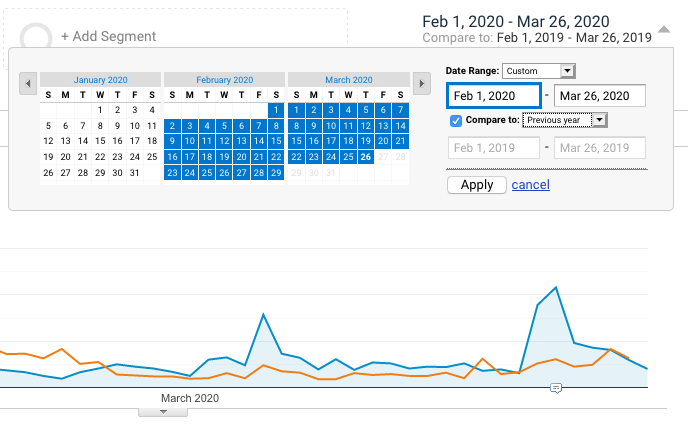
Year-over-year data is critical to understanding long-term growth or business success — or challenges. If you’ve invested in a specific channel, for example, paid advertising, you can compare year-over-year data to see overall improvement. If you combine year-over-year data with annotations, you may gain big-picture insights into how specific events or trends are impacting overall business or site activity. For example, a year from now you may notice a dramatic traffic difference due to how COVID-19 is impacting businesses and organizations.
Let us Help!
We’re happy to help you decipher your Google Analytics data, set up goals, and glean valuable insights.

